Below you will find the description of a project implemented by Camptocamp during 2008. It is based on MapFish, the Web mapping application framework.
The objective of this project is to allow for the easy display and assessment of specific socio-demographic indicators on a map by the user. The results of this geospatial-based information can then be analyzed and used by public services as a geospatial-enabled decision support for a given geographical area.
Application functionalities

Note: below, the sections in bold draw the parallel with the OLAP vocabulary.
- The user specifies a zone of interest, then chooses an administrative perimeter among a list of categories (towns, cantons, urban districts, counties, regions/provinces). This choice enables the definition of a specific reference zone for computing the indicators.
The user selects a Slice (a subset of a multi-dimensional array corresponding to a single value for one or more members of the dimensions not in the subset), using the geospatial dimension of the cube: 
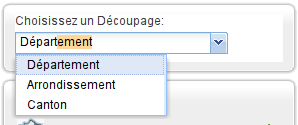
- The user chooses a spatial data aggregation level. This choice both defines the granular computing and the representation unit of the indicators.
The user performs a Drill up, navigating among levels of data ranging from the most summarized (up) to the most detailed (down):

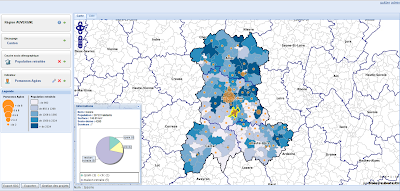
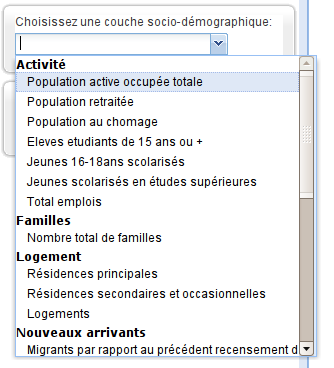
The user chooses an indicator. The socio-demographic indicators are displayed as choropleths, and business indicators are displayed as proportional symbols. Groupings (size and color) are automatically calculated by a predetermined computing formula.
The business indicators are the presence indicators of public services in a specific reference zone. These services are sorted by major topics:

The user can click on a symbol to display a pie chart representing the indicators distribution by categories of services.
Here, the multi-dimensional data structure of OLAP results in a quite simple cube using:
A group of data cells representing the services existing in a specific geographical area
Hierarchical mapping dimension
Hierarchical thematic dimension
Implementation of the following functions on the map:
Drill and Slice
Actions similar to the xactions developed in GeoReport (to retrieve data from external sources)
This project was developed without the integration of BI-type tools (client's choice). Nonetheless, it is a good model which could help identify what would be needed to have it transfered to OLAP cube-based technologies.
On the user interface level, the implementation of a MapFish module with the OLAP server interface would allow for generic map configuration settings:
Automatic scanning of the cube and presentation of machine-readable components to the user; the mapping dimension should be automatically identified.
Current analysis configuration:
map dimension (Slice + Drill)
choice and configuration of a second dimension for analysis
map projection configuration (mode, categories, ...)
The functional approach described above covers the main needs of an OLAP exploitation with the use of a dashboard. This does not require the implementation of a complete GeOLAP that would incorporate the collection of GIS paradigms and operations.
With an unplanned structure of the map dimension within the cube and the integration of geometric objects within all hierarchical levels, the OLAP capacity to recover and retrieve geometric objects will be needed.
OLAP server is able to tumble turn geometries.
A bypass mode is conceivable; the indicators and the IDs are returned by the OLAP server. The geometries are recovered directly in the database. On the IDs concordance base, they are then equated to the recovered OLAP data and provided to the map server.
The implementation of the above will be completed at the end of the first semester of 2009.
Nevertheless, this tool alone is not sufficient to conduct more profound analyses. A more comprehensive implementation of a GeOLAP becomes essential when the end-user needs ample scope on the mapping attributes/features. Besides, this approach can lead to very interesting prospects in mapping exploration of cubes by allowing arrangements, crossings, subdivisions, etc...
1 comment:
Very interesting!!
Thank you very much to CamptoCamp that wrote the article!
It is a very good example on which are the possible application fieds.
We are also waiting for GeoMondrian in order to deal with "geometry" as native type in OLAP processes!!
Compliments again to Camptocamp!
Post a Comment