Thursday 22 January 2009

Project description


WebGIS (and GIS) applications show all their limits in a complex context in which the amount of information to be analyzed is large and heterogeneous. The data flow is unidirectional: from the map to the information, even when the alphanumeric data are provided by external databases or remote services.
It is not possible to perform multi-dimensional queries, or display charts and indicators on the map for events monitoring. Typically, the alphanumeric information is "wired" in the cartographic data and interaction with external systems is limited by the nature of GIS data.
Business intelligence (BI) refers to applications and technologies that are used to gather, provide access to, and analyze data and information in order to support strategic decisions. For this reason, the BI provides tools to analyze large amounts of information quickly, and identify efficiently the changes of what is to be monitored.

Typically these tools aren't able to display on a map the analysis results but this is essential in specific contexts and for a more immediate visual impact.
These limitations suggest to integrate GIS (Geographic Information Systems) and BI (Business Intelligence), combining the potentials of both technologies.

In this scenario the BI will provide the ability to view complex analysis results on the map, and the WebGIS (GIS) the possibility to use BI tools to aggregate data.

GeoBI (GeoSpatial Business Intelligence) is the INOVA Open Source Project to integrate these two "worlds" until now separated:
  • Business Intelligence (BI)
  • GIS (Geographical Information Systems)

About the idea

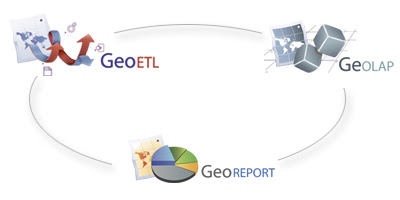
INOVA is the company leading this project and is studying and developing GeoBI as an Open Source suite composed by three major modules: GeoReport, GeOLAP and GeoETL.

The technologies on which INOVA is focused on are: JAVA for BI processes and OGC standards e.g. WMS, SLD, WFS, WFS-T, WPS, ecc.. for WebGIS components.
The products on which INOVA is focused on are: Pentaho, GeoKettle and GeoMondrian for BI-GIS integration and OpenLayers, Mapfish, GeoServer for WebGIS development.
You can found references in the "Products" and "Links" panels of this blog!

GeoBI allows:

  1. visualization on a cartographic map of mono and multidimensional analysis results

  2. cartographic reports generation

  3. spatial ETL processes

GeoBI consists of three modules:

  1. GeOLAP: to display multidimensional analysis results on a cartographic map, via Web

  2. GeoReport: to generate cartographic reports and display charts, diagrams and indicators on the map, via Web

  3. GeoETL: to extract, trasform and load in a DWH (Data WareHouse) every kind of data, dealing with "geometry" as a native type


GeoReport module

GeoReport Module

At the present only GeoReport Module has been developed as a prototype while solutions for GeOLAP development are in progess. INOVA has chosen GeoKettle as GeoETL module, that is based on Pentaho Kettle.

GeoReport integrates spatial information in BI processes so that thematic maps beacame a new way to display the results of complex analysis on alphanumeric data provided by external and remote sources.

The module provides Cartographic Reports managing a bidirectional data flow as in the picture below:

GeoReport is able to:

  1. display alphanumeric data coming from Business Intelligence processes (xaction in Pentaho) in a cartographic mode

  2. use Geostatical functionalities on cartographic data such as "Choropleth Map" and "Proportional Symbols". The indicators for that kind of analysis caming from BI processes

  3. display charts, diagrams and indicators directly from the map click

Users can set:

  • the map name

  • vectors features using GeoServer

  • the ID to match geometries to alphanumeric data

  • the attributes (coming from BI processes) to display on feature selection

  • the kind of GeoStatistcal analysis to do (choropleths or proportional)

  • the indicators for GeoStatistical analysis

  • xactions to retreive data from external sources

  • charts, diagrams, indicators to display on geometry selection


GeoReport Architecture

GeoReport consits of two modules:

  1. MapOL

  2. Dashboard

MapOL runs the xaction configurated by the user and join the resultsets with the geometries coming from Geoserver in a single GeoJson data.

Geometries must have only an ID in order to match them with the attributes.

Dashboard requests GeoJson to MapOL in order to display the fetures (geometries + attributes) on the map using OpenLayers and Mapfish Client (with Geostat widgets)

A map click event on features selection allows to display charts, diagrams and indicators directly on the map.

MapOL

Dashboard

GeoReport in action!!

Here some videos showing GeoReport module in action:


SWF


YOUTUBE


  1. The user uploads geometries with only the IDs in Geoserver and configure Pentaho xactions to retreive alphanumeric information from DWH (Data WareHouse).
    In this example the geometries are POINTS and represent Italian regional capitals.
    The module MapOL runs an xaction to retrieve all the attributes to associate to these POINTS. In particular they are the information stored in the INOVA DWH (Data WareHouse) and in particular in WATSON databases. WATSON is the INOVA VoIP product. For each Italian region the xaction returns the numebr of sold WATSON and the revenues in that region.
  2. User logs in PentahoBI system that provides also a cartographic dashboard:
    http://server_name/pentaho/Dashboards?dashboard=GeoBI
  3. The cartographic dashboard is developed using Mapfish Client + Geostat widgets and OpenLayers. The Dashboard module requests GeoJson to MapOL module and displays it in the WebGIS client.
  4. User can choose from choropleths or proportional symbols analysis using one or more indicators coming from Business Intelligence. He can set indicators before lunching PentahoBI (that contains GeoReport). In this example the indicators are the WATSON number per region and the revenues per region
  5. User can click on the features to not only display alphanumeric information, but also to display indicators about the number of sold WATSON in a region rispect a min and a max budgeted value and a pie that shows the number of sold WATSON in each province of that region.

Screenshots

Here some GeoReport screenshots:
  • Proportional Symbols


  • Choropleths

"Multidimensional" WebGIS


As described in the picture above, WebGIS applications are related to spatial information, while BI (Business Intelligence) and MIS (Management Information Systems) systems are usually disjoined from it..they deal with alphanumeric data!
In a context in which BI-MIS and GIS technologies are joined, we prefer to use the term: Multidimensional WebGIS.
A Multidimensional WebGIS is a WebGIS application integrated in a BI environment, and able to:


(from Openhealth-DHIS2 online demo)
At the present this module doesn't support DRILL operations, the picture above is only an example
  • receive data from OLAP server and display spatial dimension as a cartographic feature on the map
    (the layers involved in only one OLAP analysis are more than one so for each OLAP analysis a Multidimentional WebGIS is able to swich from a map to another. Each map contains an OLAP "Measure")
  • display charts, diagrams and indicators on the map
  • do tipical BI operations as DRILL UP, DRILL DOWN directly from the map

GeOLAP: example of functional exploration

Below you will find the description of a project implemented by Camptocamp during 2008. It is based on MapFish, the Web mapping application framework.

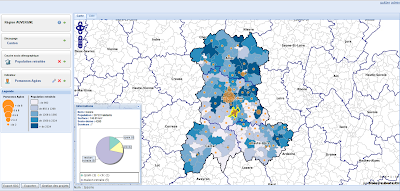
The objective of this project is to allow for the easy display and assessment of specific socio-demographic indicators on a map by the user. The results of this geospatial-based information can then be analyzed and used by public services as a geospatial-enabled decision support for a given geographical area.

Application functionalities


Cartography is the main approach and focus of this application. However, access to the numeric data of the indicators is possible.

Note: below, the sections in bold draw the parallel with the OLAP vocabulary.

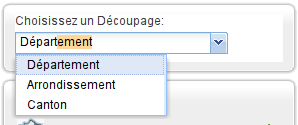
  • The user specifies a zone of interest, then chooses an administrative perimeter among a list of categories (towns, cantons, urban districts, counties, regions/provinces). This choice enables the definition of a specific reference zone for computing the indicators.
    The user selects a Slice (a subset of a multi-dimensional array corresponding to a single value for one or more members of the dimensions not in the subset), using the geospatial dimension of the cube:

  • The user chooses a spatial data aggregation level. This choice both defines the granular computing and the representation unit of the indicators.

    The user performs a Drill up, navigating among levels of data ranging from the most summarized (up) to the most detailed (down):


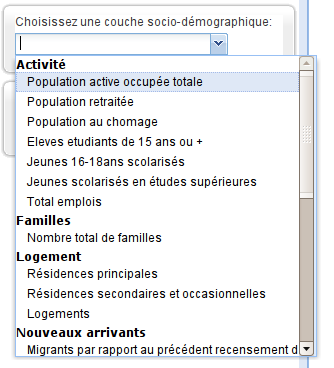
  • The user chooses an indicator. The socio-demographic indicators are displayed as choropleths, and business indicators are displayed as proportional symbols. Groupings (size and color) are automatically calculated by a predetermined computing formula.

    The business indicators are the presence indicators of public services in a specific reference zone. These services are sorted by major topics:


  • The user can click on a symbol to display a pie chart representing the indicators distribution by categories of services.

Here, the multi-dimensional data structure of OLAP results in a quite simple cube using:

  • A group of data cells representing the services existing in a specific geographical area

  • Hierarchical mapping dimension

  • Hierarchical thematic dimension

Implementation of the following functions on the map:

  • Drill and Slice

  • Actions similar to the xactions developed in GeoReport (to retrieve data from external sources)

This project was developed without the integration of BI-type tools (client's choice). Nonetheless, it is a good model which could help identify what would be needed to have it transfered to OLAP cube-based technologies.

On the user interface level, the implementation of a MapFish module with the OLAP server interface would allow for generic map configuration settings:

  • Automatic scanning of the cube and presentation of machine-readable components to the user; the mapping dimension should be automatically identified.

  • Current analysis configuration:

    • map dimension (Slice + Drill)

    • choice and configuration of a second dimension for analysis

    • map projection configuration (mode, categories, ...)

The functional approach described above covers the main needs of an OLAP exploitation with the use of a dashboard. This does not require the implementation of a complete GeOLAP that would incorporate the collection of GIS paradigms and operations.

With an unplanned structure of the map dimension within the cube and the integration of geometric objects within all hierarchical levels, the OLAP capacity to recover and retrieve geometric objects will be needed.

  • OLAP server is able to tumble turn geometries.

  • A bypass mode is conceivable; the indicators and the IDs are returned by the OLAP server. The geometries are recovered directly in the database. On the IDs concordance base, they are then equated to the recovered OLAP data and provided to the map server.

The implementation of the above will be completed at the end of the first semester of 2009.

Nevertheless, this tool alone is not sufficient to conduct more profound analyses. A more comprehensive implementation of a GeOLAP becomes essential when the end-user needs ample scope on the mapping attributes/features. Besides, this approach can lead to very interesting prospects in mapping exploration of cubes by allowing arrangements, crossings, subdivisions, etc...